State-Level Solar Data Provides Hours Of Fun

By Frank Andorka, Senior Correspondent

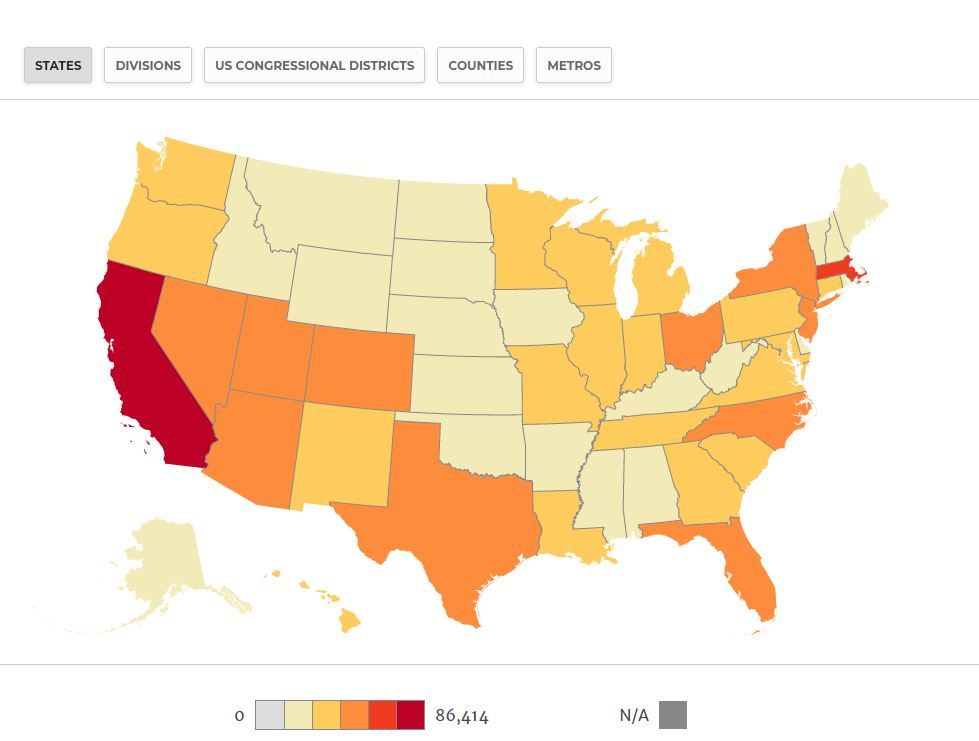
What Happened: The Solar Foundation released its follow-up to the National Solar Jobs Census 2017 in the form of its interactive state map, which:

  • provides a remarkably detailed look at how solar is affecting the lives of people in your Congressional District.
  • offers a historical look at the data for the same area.
  • gives more granular detail on how solar is providing jobs and economic impacts on people – which can be used to inform lobbying efforts.

SolarWakeup’s View:  Well, I know how I’ll be spending every waking moment this weekend – looking at The Solar Foundation’s (TSF) state-level solar data on their interactive state solar map (hey, I’m practically an elderly shut-in, don’t judge).

[wds id=”3″]

I remember the first time they released this information. I literally spent hours looking at Cuyahoga County, where I live in Ohio. Specifically, I looked at the 11th District (which in The Hunger Games produced the fruit of Panem, which is clearly not happening in Cleveland, though I live across from an area that USED to be an apple orchard and is now a medical center … but I digress) and poured over the numbers so I’d be better prepared to talk solar with my state and federal representatives on the subject.

Look, I’ve talked about this before, but the solar industry does an incredibly poor job of mobilizing the general public to fight its fights on the state and local level. But when I look at this map, I’m confounded by why that is.

This could be such a powerful tool to mobilize the Solar Army I’ve written about before. The information from this map proves solar is having tangible, real-life effects in almost every Congressional district in the country, and if you don’t think politicians will listen to their constituents if their offices are flooded with pro-solar calls, you’re mistaken. We’ve already seen it work on other issues in the country. It can work for solar, too.

(If you’re listening, Andrea Luecke, the only thing that would make this map even MORE spectacular is if, when you clicked on your Congressional District, it provided you the opportunity to contact your U.S. Representative from that page. Oh, and Senators, too. Get on that for next year, would you?)

Now if you’ll excuse me, I’m going to get my time sucked right out of my day. I’ve got a new shiny state-level solar data map from TSF with which to play.

More:

State-Level Solar Data Map

National Solar Jobs Census

The Solar Foundation

Breaking Down The Top Data from GTM Solar Summit 2015

By Yann Brandt

solar ppa pricingGreentech Media’s Solar Summit 2015 (#GTMSS2015) brought together over 500 of solar’s brightest. The solar summit tends to be a bit different than many other conferences since the focus is on data and research, rather than products and services. The event kicked off with Shayle Kann of Greentech Media, who broke down the current state of the solar market and with some sharp analyses. For the full coverage on the presentation, see here.

  1. Utility Scale Solar Costs Decline and Offtakers Base Grows

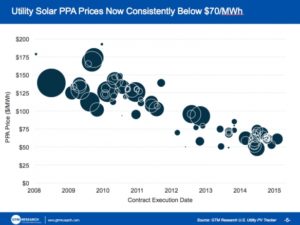
Utility scale solar is now consistently below $70/MWh and is being installed around the world at rates that match this new price, which shows signs of exponential growth. Now, to create new markets, we need a stable offtake environment and the lowest prices possible. There is cost to risk, so a 30-year merchant solar plant would likely average rates higher than $70/MWh. On the other hand, there is value for a hedge, which solar energy provides to utilities.

How does this affect the solar market?

With these lowered prices plus community solar, virtual net-metering, and direct access to customers who want solar, solar developers can sell the energy directly to users. Just look at the 130MW project for Apple — all of that energy is purchased by Apple but produced by a single, massive solar farm.

  1.  Residential Solar Market Gets Saturated

While there are 113 million households in America, it seems only 9 million can actually receive solar cost effectively. First, you start by removing the homes that are rented. Then, you narrow to homes in states that support solar and homes with sunny enough roofs. After, you need people with the proper FICO score. The total number of viable homes goes down 90%, leaving just 9 million homes. One interesting reduction is the 38 million homes in solar friendly states to 29 million homes that have the right FICO score.

How does this relate to other solar markets?

Imagine doing the same analysis in commercial solar. Going from all commercial buildings to commercial buildings in solar friendly markets is an easy analysis and in some markets represents almost 50% of total energy usage. For hypothetical purposes, let’s assume that the same is true for commercial and 33% of buildings are in solar friendly states.

Looking at the prior cutoff, does the tenant own their building? Probably a lower number than the residential comparison, but looking at the next question of “how many tenants/building owners have a FICO of over 680?”

That is the question of the day in my mind. How do you index the commercial solar credit outside of publicly traded customers? Yes, you can look at three years of financial statements, but how can you do that quickly and cost effectively?

  1.     The bundles energy market is here, going to get bigger, and more utilities are getting involved

We have already seen utilities get into non-regulated solar development and owning solar assets in their portfolio. Innovation, on the regulated side of utility headquarters, is becoming more prevalent. Florida’s investor-owned utilities have brought this up to the tune of nearly 1GW, and other states have already seen their regulators make decisions on this new era of energy system. On the other hand, things are also getting smaller like partnerships with EV charging stations, demand response systems, or home automation.

Does solar really benefit from this?

More solar is always a good thing for the sector, it means more jobs, more manufacturing, and more competition that drives the cost of capital down. Equally important, we can put resources toward the customer experience when we know there are plenty.

In the past it was a challenge to bring the rooftop industry down to eye level by doing a monitoring setup or something similar. Today, the ability of a bundled package increases the touchpoint between solar generation and the customer, which will make many more users become solar evangelists.

Being at Greentech Media’s Solar Summit was another great learning experience. Speaking on the crowdsourcing panel, I was, as usual, surprised by the general consensus of the industry. So while it always seems like I am a contrarian, I saw it more like an opportunity to have my thoughts challenged. The next events for me are Intersolar, Solar Securitization, and REFF Wall Street. I look forward to meeting you there.

Originally Posted on Conergy.com

Solar Going Mainstream? 5 Projections for 2015

By Jason Kaminsky

Now that 2014 has come to an end and we’ve seen a preview of what 2015 has in store, we felt it was the right time to put together our projections for the year. We look forward to picking this back up in 2016 and seeing how many of these actually materialized over the course of the year.

  1. Utility rates will be restructured – impacting existing solar users: 

While states like Hawaii are proposing modifications to their NEM rate structures for new customers only, proposals in California and Arizona are establishing a precedent that rate design can impact existing owners of residential solar PV systems. California’s IOUs are proposing to the CPUC a fixed-charge to help cover the fixed cost of providing service, as well as a reduction from 4 tiers to 2 tiers, with a lower kilowatt-hour rate for large electricity consumers. Arizona utilities are proposing large fixed charges (estimated to be $50 / mo for the average solar user), with a grandfather clause of only 10 years for existing customers – even those currently in a 20 year lease. We expect that at least one of these states will pass rate reform in a way that does not fully protect existing solar users.

  1. Customer focus on savings:

Technical discussions about rate design and NEM will spill into the mainstream media, leading consumers to re-evaluate their contracts. An easy consumer-facing tool to will enter the market (AmISavingMoneyOnMySolar.com is still available, folks!) and some consumers will be surprised to discover that savings did not match expectations. System performance issues that had previously gone unnoticed will also receive greater attention. Selective default risk will increase.

  1. Predictive scorecarding will begin to develop:

Almost the entire solar industry underwrites to FICO scores, but there are many other contributing factors that one would logically conclude may lead to payment disruption- consumer savings chief among them. To understand homeowner satisfaction, one needs insight into both a) system performance and b) contract structure, including initial rate and annual escalator. Solar developers will increasingly see the importance of being able to integrate their electricity production and payment performance databases for the purpose of predictive analytics and will use these tools to improve asset management of existing portfolios, to inform underwriting standards, or to analyze refinancings (via securitization, warehouses, asset sales to YieldCos, etc.).

    4.  Investor focus on performance:

In tandem, investors will increasingly focus on customer experience over the life of the transaction in their underwriting of residential solar portfolios. We see solar portfolios of thousands of systems operating in a range akin to a “peaky” normal curve, and investors will closely monitor the tails of actual energy production and expected homeowner savings relative to baseline expectations. Additionally, investors will push the origination community to use increasingly conservative rate escalators in their consumer contracts.

    5.  Industry benchmarking will become standard:

In fragmented industries that have access to liquid capital markets, firms exist that provide industry benchmarking and analytics services. Corelogic does this service in residential mortgages, Measure One in student loans, Trepp in commercial mortgages, etc. We believe that new investors will seek out industry data to support their underwriting, and existing investors will benchmark their portfolios to industry standards to evaluate performance. The trend toward a more mature asset class, where the data is used to establish industry trends and open the capital markets vs. being siloed throughout the industry, will continue.

2015 will be a period of continued growth in the industry – Lyndon Rive has gone on record that every major provider should plan for 100% growth this year. As a result, many companies will be in a position of quickly scaling their origination pipeline using their existing software systems, while needing to adapt in order to support the needs of more sophisticated underwriting and to satisfy the demands of investors. This push for scalability will continue the need for software solutions focused on data management, data analytics, and independent industry benchmarking.

About the author: Jason Kaminsky is the Vice President of Partnerships at kWh Analytics. Founded in 2012, kWh Analytics enables solar investors and originators to take control of their risk management and asset reporting through a web-based portfolio management platform. The platform delivers risk insights and industry benchmarks from 40,000+ PV systems, integrated with an industry-leading analytics platform. The firm’s clients include several of the leading solar originators and financial institutions. http://www.kwhanalytics.com/

This is your SolarWakeup for November 6th, 2013

The solar industry is packed with some of the greatest innovators and entrepreneus in the Country.  At times, however, we let some of the downturn of the sector get to us and we don’t always help each other as much as we could.  Take a moment and help someone today, make an intro, help someone get into a door or sign a petition.  Working together, we will strengthen the industry for everyone.

News

Opinions

Have a great day!

Yann