
By Frank Andorka, Senior Correspondent
What Happened: The Solar Foundation released its follow-up to the National Solar Jobs Census 2017 in the form of its interactive state map, which:
- provides a remarkably detailed look at how solar is affecting the lives of people in your Congressional District.
- offers a historical look at the data for the same area.
- gives more granular detail on how solar is providing jobs and economic impacts on people – which can be used to inform lobbying efforts.
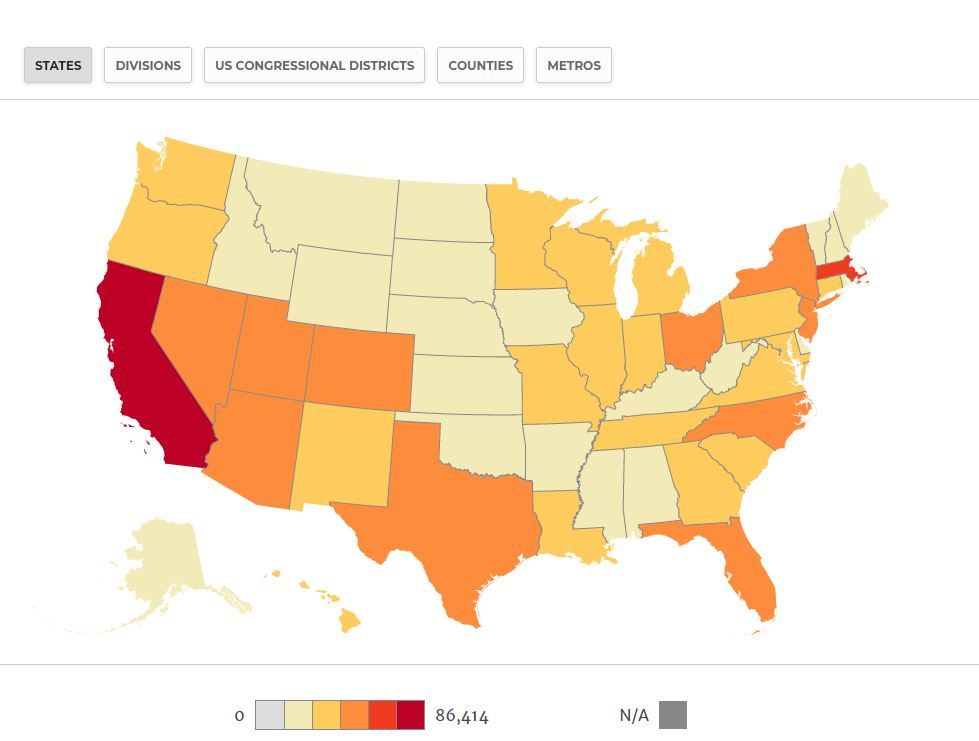
SolarWakeup’s View: Well, I know how I’ll be spending every waking moment this weekend – looking at The Solar Foundation’s (TSF) state-level solar data on their interactive state solar map (hey, I’m practically an elderly shut-in, don’t judge).
I remember the first time they released this information. I literally spent hours looking at Cuyahoga County, where I live in Ohio. Specifically, I looked at the 11th District (which in The Hunger Games produced the fruit of Panem, which is clearly not happening in Cleveland, though I live across from an area that USED to be an apple orchard and is now a medical center … but I digress) and poured over the numbers so I’d be better prepared to talk solar with my state and federal representatives on the subject.
Look, I’ve talked about this before, but the solar industry does an incredibly poor job of mobilizing the general public to fight its fights on the state and local level. But when I look at this map, I’m confounded by why that is.
This could be such a powerful tool to mobilize the Solar Army I’ve written about before. The information from this map proves solar is having tangible, real-life effects in almost every Congressional district in the country, and if you don’t think politicians will listen to their constituents if their offices are flooded with pro-solar calls, you’re mistaken. We’ve already seen it work on other issues in the country. It can work for solar, too.
(If you’re listening, Andrea Luecke, the only thing that would make this map even MORE spectacular is if, when you clicked on your Congressional District, it provided you the opportunity to contact your U.S. Representative from that page. Oh, and Senators, too. Get on that for next year, would you?)
Now if you’ll excuse me, I’m going to get my time sucked right out of my day. I’ve got a new shiny state-level solar data map from TSF with which to play.
More: